25. Claim cost summary report (CIS report)
This report is part of our Customer Information System (CIS).
About the report
Description: This report illustrates:
- The estimated cost of your agency's claims for injuries suffered in the shown injury years at the most recent estimate date.
- The estimated cost of your agency's claims for the same injury years based on the development of claims to the end of the previous February (that is the development that we used to calculate your last premium).
- The change in estimated cost between these two development points.
- The number of claims accepted after we calculated premiums and how much of the estimated cost relates to these claims.
Access level required: Management level access
Export options: .pdf, .rtf
Benefits: When Comcare calculates each agency's premium for the coming year we also revise each premium rate for the previous year. This revision will recognise the development to the end of February in the current year for injuries suffered in earlier injury years. Whether we revise an agency's premium rate up or down will depend on how that agency's claims have developed from the end of February in the previous year to the end of February in the current year relative to other agency's claims. This revised rate will form the starting point for calculating the upcoming years premium rate. It will also determine whether the agency gets a bonus or a penalty in the upcoming premium.
To allow agencies to better see which claims have had the greatest increase in estimates, this report has drill down functionality. Simply click in the chart on an individual injury year and claims that have had an increase of over $40,000 since the February estimate will be listed. If no claims are listed on the drill down report then no claims have had an increase of $40,000 or more.
Some important notes to consider when reading this report:
- The current year's figure is not shown as it is too early to calculate estimates for these injuries. For an indication of how the current year is developing CIS report 1 – Progressive Costs Report provides a better gauge for comparing the current year with earlier years at the same development point.
- The premium of an agency does not change by a dollar for dollar change in estimated claim cost for that agency.
- The figures in this report are different from the figures used to calculate premiums reported on the "Premium Quick Reference Sheet". The premium system adjusts the base figures to allow for injuries suffered but for which Comcare has not yet accepted a claim when we calculate premiums.
Parameters: The report is calculated based on Accepted claims with a date of injury within the last 4 years inclusive of the current year.
Fields in the report
| Field | Description |
|---|---|
| Injury Year | The year that the accepted claims injury occurred. |
| Feb Estimate($) | The estimate of claim costs based on data to the end of February. |
| Latest Estimate($) | The estimate of claim costs based on data to the end of the latest estimate date. |
| Latest Estimate Date | The date to which data has been included in the latest estimate. |
| No. Claims Post Feb Est | The number of claims that have been accepted post the February estimate date. |
| Post Feb Estimate($) | The estimate as of the latest estimate date on claims accepted after the February estimate date. |
Example report
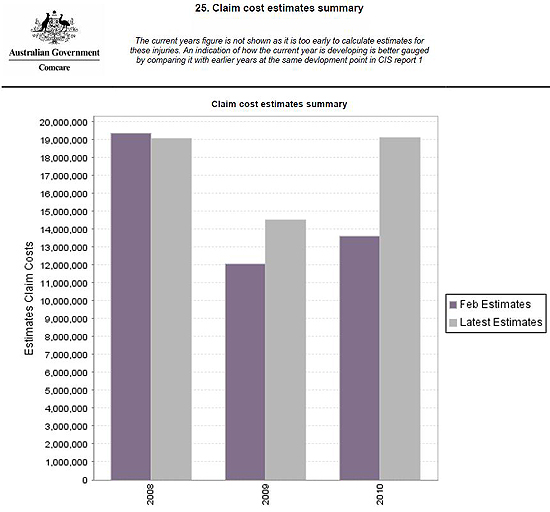
| Injury Year | February Estimate($) | Latest Estimate($) | Latest Estimate Date | No. Claims Post February Estimate | Post February Estimate($) |
|---|---|---|---|---|---|
| 2008 | 19,364,847.00 | 19,049,770.91 | 31/12/2011 | 6 | 1.769,702.77 |
| 2009 | 12,073,501.73 | 14,496,582.01 | 31/12/2011 | 13 | 5,956,152.05 |
| 2010 | 13,623,811.68 | 19,091,918.37 | 31/12/2011 | 57 | 8.093.968.67 |